
Last month we helped a SaaS customer troubleshoot a familiar pattern: a 2-core, 4 GB VPS with CPU sitting around 20%, yet every afternoon at 3 PM the site turned into a slideshow. Cloud monitoring showed outbound bandwidth pegged at the limit—a 100 Mbps plan maxed out for forty straight minutes. Their first instinct was to upgrade. We pulled the Nginx access logs and found 70% of traffic was uncompressed JSON API responses and static JS files with random ?v= query strings, meaning the same assets were being shipped in full over and over.
After tuning Gzip, static cache headers, and upstream keepalive, peak bandwidth dropped to 35 Mbps and page load time fell from 8 seconds to 1.2 seconds—without spending a cent. This story plays out constantly on small VPS instances: the bottleneck is egress bandwidth, not compute. Nginx sitting between users and your backend is the best lever for saving bandwidth—if you know which knobs to turn.
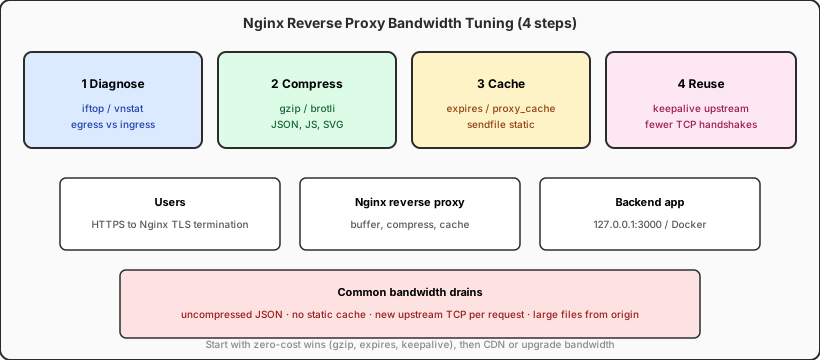
This article is not an Nginx install primer. It is a bandwidth-focused tuning checklist we have validated in production: diagnose first, then compress, cache, and finally optimize connection reuse and buffering. The assumption is you already run Nginx as a 443 reverse proxy (if the firewall is not locked down yet, start with our cloud server UFW firewall setup guide—open only 22/80/443 before tuning).
Why bandwidth maxes out before CPU
Cloud VPS bandwidth plans are often asymmetric: a small tier might offer 100 Mbps peak with 1–2 TB monthly transfer. That sounds generous until an uncompressed 500 KB JSON endpoint sees 200 requests per second—that is 800 Mbps of theoretical demand, blowing past the cap instantly. Meanwhile Nginx serving static files and simple reverse proxy traffic barely touches CPU, which is why monitoring dashboards show the classic mismatch: CPU idle, bandwidth saturated.
Another common mistake is routing every byte through the origin. Without a CDN, without browser caching, and without proxy_cache, every user refresh re-downloads bundle.js and logo.png from your VPS. The HTTP modules listed in the official Nginx documentation are essentially a toolbox for sending fewer bytes or opening fewer connections—the trick is combining them for your workload, not copying a one-size-fits-all config into production.
| Symptom | Likely cause | First move |
|---|---|---|
| Slow API, high bandwidth | Uncompressed JSON/HTML | Enable gzip / brotli |
| Heavy traffic on page refresh | Static assets missing Cache-Control | expires + fingerprinted filenames |
| Backend connection count spikes | New upstream TCP per request | keepalive connection pool |
| Large downloads saturate egress | Origin direct transfer, no segmented cache | CDN or proxy_cache |
Step 1: Diagnose before upgrading bandwidth
Before touching config, spend ten minutes confirming where bandwidth is going. On the server we typically run:
# Live traffic by connection (apt install iftop)
                sudo iftop -i eth0

                # Hourly/daily stats (vnstat)
                vnstat -h
                vnstat -d

                # Nginx access log: find largest URLs by bytes
                awk '{print $7, $10}' /var/log/nginx/access.log | \
                  awk '{a[$1]+=$2} END {for(i in a) print a[i], i}' | sort -rn | head -20

                # Current ESTABLISHED connection count
                ss -s
                ss -tn state established | wc -l
If the top URLs are /api/ endpoints with response bodies in the hundreds of KB, compression is priority one. If the leaders are .js, .css, and .woff2 files all returning 200 (no 304), cache headers are missing. Also separate inbound from outbound: DDoS or aggressive crawlers can saturate ingress—that is a different problem (rate limiting, WAF, fail2ban). This article focuses on outbound optimization for normal traffic.
Cloud console bandwidth charts aggregate over 1–5 minutes; for live troubleshooting, trust iftop on the host. If SSH itself feels sluggish, see our Linux server SSH connection refused troubleshooting guide to rule out network-layer issues first.
Step 2: Gzip / Brotli compression—the cheapest bandwidth cut
Text responses (JSON, HTML, JS, CSS, SVG, XML) typically compress 60%–80%. Nginx ships with the built-in gzip module—a few lines of config, and the extra CPU cost is acceptable on most VPS instances.
gzip on;
                gzip_vary on;
                gzip_proxied any;
                gzip_comp_level 5;          # 6–9 diminishing returns; 5 is the sweet spot
                gzip_min_length 256;        # skip tiny responses
                gzip_types
                    text/plain
                    text/css
                    text/javascript
                    application/javascript
                    application/json
                    application/xml
                    image/svg+xml
                    font/woff2;
A few production notes: first, gzip_proxied any ensures proxied backend responses get compressed (by default only direct responses are). Second, do not gzip images (JPEG/PNG/WebP) or video—already-compressed binaries gain almost nothing and waste CPU. Third, verify with curl -H 'Accept-Encoding: gzip' -I https://your.site/api/foo and confirm Content-Encoding: gzip in the response headers.
If your build includes the Brotli module (some distros or custom compiles), Brotli saves another 15%–20% over gzip at similar quality—great for text-heavy API sites. No module? Get gzip solid first; that alone covers most cases.
Step 3: Static asset caching and sendfile
Frontend build tools (Vite, Webpack) add content hashes to filenames, e.g. app.a3f2b1.js. Those files can be cached long-term—repeat visits never hit the network. The problem is many teams hash at build time but never set Cache-Control in Nginx, so browsers still request the full file every time.
location ~* \.(js|css|woff2?|ttf|ico|svg)$ {
                    root /var/www/app/dist;
                    expires 30d;
                    add_header Cache-Control "public, immutable";
                    access_log off;           # disable access_log on static hits to cut IO
                }

                # recommended in the http block
                sendfile on;
                tcp_nopush on;
                tcp_nodelay on;
sendfile lets the kernel push file page cache directly to the socket, reducing user-space copies—helpful for large static files and high-concurrency downloads. Note: combining sendfile with AIO or thread pools needs testing; the default trio (sendfile + tcp_nopush + tcp_nodelay) is enough for most sites.
Do not mark HTML or index.html as immutable, or users may see a stale shell after deploy. The usual split: hashed assets for 30 days, HTML with no-cache (revalidation allowed).
Step 4: Reverse proxy caching (proxy_cache)
For read-heavy APIs (config lists, product catalogs, article detail), a short TTL cache at Nginx divides origin bandwidth by your hit rate. It is one of the most underrated features of the proxy module.
# http block
                proxy_cache_path /var/cache/nginx levels=1:2 keys_zone=apicache:50m
                                 max_size=2g inactive=60m use_temp_path=off;

                upstream backend {
                    server 127.0.0.1:3000;
                    keepalive 32;              # see next section
                }

                server {
                    location /api/ {
                        proxy_pass http://backend;
                        proxy_http_version 1.1;
                        proxy_set_header Connection "";

                        proxy_cache apicache;
                        proxy_cache_valid 200 5m;
                        proxy_cache_key "$scheme$request_method$host$request_uri";
                        add_header X-Cache-Status $upstream_cache_status;

                        proxy_buffering on;
                        proxy_buffers 16 16k;
                        proxy_busy_buffers_size 64k;
                    }
                }
$upstream_cache_status returns HIT, MISS, or BYPASS—instant visibility when debugging. Writes (POST/PUT/DELETE) must bypass cache; personalized endpoints with cookies need care so user A's data never serves to user B.
With proxy_buffering on, Nginx buffers the full backend response before streaming to the client—when the backend is slow and the client is fast, that frees upstream connections sooner. For streaming SSE or large uploads, set proxy_buffering off on those locations.
Step 5: upstream keepalive to cut TCP handshake overhead
By default Nginx may open a fresh TCP connection to the backend for every client request. At high QPS, TIME_WAIT piles and repeated handshakes eat CPU and local ports, slowing responses and shrinking effective bandwidth. upstream keepalive maintains a connection pool to the backend—when a request finishes, the connection goes back to the pool.
upstream backend {
                    server 127.0.0.1:8080;
                    keepalive 64;               # pool size; tune for QPS
                }

                location / {
                    proxy_pass http://backend;
                    proxy_http_version 1.1;     # HTTP/1.1 required for keepalive
                    proxy_set_header Connection "";  # clear Connection: close
                }
Miss either proxy_http_version 1.1 or Connection "" and keepalive silently fails—the most common "configured but not working" case we see in customer environments. A pool of keepalive 64 is plenty below roughly a million daily pageviews; going larger mainly consumes backend file descriptors.
Step 6: workers, connections, and rate limits
When bandwidth is saturated, confirm Nginx is not the connection bottleneck. Core settings live at the top of nginx.conf:
worker_processes auto;
                worker_rlimit_nofile 65535;

                events {
                    worker_connections 4096;
                    use epoll;
                    multi_accept on;
                }

                # optional: per-IP rate limit to stop one client hogging bandwidth
                limit_req_zone $binary_remote_addr zone=perip:10m rate=10r/s;
                limit_conn_zone $binary_remote_addr zone=conn:10m;

                server {
                    limit_req zone=perip burst=20 nodelay;
                    limit_conn conn 50;
                }
worker_connections × worker_processes must exceed peak concurrent connections. On a 2-core box, worker_processes auto is usually 2, so 4096 × 2 = 8192 headroom for most small sites. Align system fs.file-max with worker_rlimit_nofile, or logs will show too many open files.
limit_rate caps per-connection throughput (large downloads); limit_req throttles abusive API callers. These do not add bandwidth, but they stop a few bad actors from ruining everyone else's experience—the last gate in bandwidth governance.
Step 7: When is it time for a CDN?
When tuning is done and bandwidth still pegs periodically, look at a CDN or a larger plan. The decision is straightforward:
- Static assets account for 60%+ of egress → CDN caches JS/CSS/images; origin serves only HTML and API
- Users span multiple regions → edge nodes shorten physical distance, effectively lowering origin bandwidth pressure
- Traffic spikes (campaigns, live events) → CDN absorbs peaks so you are not buying origin bandwidth for the worst case
After adding a CDN, lock the origin to CDN backhaul IPs only (firewall allowlist) and pass the real client IP (X-Forwarded-For / real_ip module). Otherwise attackers hit the origin directly and bypass CDN protection and caching.
Full server block example (swap domain and deploy)
Below is a minimal runnable config combining the pieces above—suited to a Node or Python backend on 127.0.0.1:3000:
upstream app {
                    server 127.0.0.1:3000;
                    keepalive 32;
                }

                server {
                    listen 443 ssl http2;
                    server_name app.example.com;

                    ssl_certificate     /etc/letsencrypt/live/app.example.com/fullchain.pem;
                    ssl_certificate_key /etc/letsencrypt/live/app.example.com/privkey.pem;

                    gzip on;
                    gzip_types application/json application/javascript text/css text/plain;
                    gzip_min_length 256;

                    location /assets/ {
                        alias /var/www/app/dist/assets/;
                        expires 30d;
                        add_header Cache-Control "public, immutable";
                        access_log off;
                    }

                    location / {
                        proxy_pass http://app;
                        proxy_http_version 1.1;
                        proxy_set_header Host $host;
                        proxy_set_header X-Real-IP $remote_addr;
                        proxy_set_header X-Forwarded-For $proxy_add_x_forwarded_for;
                        proxy_set_header X-Forwarded-Proto $scheme;
                        proxy_set_header Connection "";
                    }
                }
Run sudo nginx -t && sudo systemctl reload nginx, then check the browser Network panel: static assets should show 30-day cache, APIs should show gzip. We add this to every release checklist: curl -sI https://app.example.com/assets/main.js | grep -i cache.
Verification and ongoing monitoring
Tuning is not one-and-done. In Grafana or cloud monitoring, watch four lines together: outbound bandwidth, Nginx active connections, upstream response time, and cache hit rate (if proxy_cache is enabled). Before a release or traffic event, benchmark: ab -n 1000 -c 50 https://app.example.com/ or hey -n 5000 -c 100, and record peak bandwidth and P95 latency before and after.
If bandwidth drops but latency stays high, the bottleneck may have moved to the database or disk IO—that is a different article. At least you will know the money belongs in indexes, not a blind jump to a 500 Mbps plan.
Beyond tuning: node placement matters too
Nginx helps you send fewer bytes, but physics still governs distance. If your audience is in Asia-Pacific and the VPS sits in US East, high RTT and retransmits cut effective throughput no matter how tight the config. Many teams run builds and previews on a cloud Mac or a closer node, serve static assets from object storage plus CDN, and keep the origin API-only—the bandwidth bill looks much better.
VPSSPark's Mac mini M4 cloud nodes fit CI builds, internal previews, and jump-host ops: native macOS, Terminal and OpenSSH ready out of the box; idle draw around 4W, fine for 24/7 relay or build duty without another x86 box. Pair that with UFW on 443 only and apps bound to 127.0.0.1, and both attack surface and wasted bandwidth stay in check.
If you are sketching a bandwidth-efficient, low-ops deployment, VPSSPark cloud Mac mini is a practical low-power relay and build node— see plans and pricing so Nginx tuning is not undone by picking the wrong region.