On 18 August 2026 the NSA posted Ghidra 12.1.3 on GitHub. The asset you want is ghidra_12.1.3_PUBLIC_20260817.zip (~543 MB); the SHA-256 is on the release page. People searching for a Ghidra 2026 tutorial usually stall on three stacked mistakes: the wrong JDK, downloading Source Code instead of the multi-platform ZIP, and practising on software they have no right to reverse. This walkthrough covers install, decompile, debug, and binary analysis — only for programs you are allowed to inspect: binaries you built, samples your employer authorised, or research material in an isolated lab.
Ghidra is not a magic “restore the original source” button. It is NSA’s open-source reverse-engineering framework: disassembly, decompilation, cross-references, scripts, and a debugger in one project. It is still worth learning in 2026 because it is free, cross-platform, and in the same league as commercial tools for reading structure. The 12.1 line pins the runtime to JDK 21 and wants Python 3.9–3.14 for the debugger. Read the official Getting Started and What's New in Ghidra 12.1 before you trust a three-year-old screenshot.
Why open Ghidra in 2026 instead of staring at a raw listing
In security research and firmware triage, the slow part is not “seeing instructions”. It is naming functions correctly, putting types back, and walking xrefs to see who calls whom. That is Ghidra’s job: Listing shows bytes, the Decompiler shows readable pseudo-C, and the cursors stay in sync. Rename a variable and the C window updates — faster than sticky notes on a pure disassembly.
The other win is project hygiene. A Ghidra Project keeps files, analysis flags, bookmarks, and comments together. Two people can share a project instead of forwarding “line 147 might be a key”. 12.1 also ships Headless, PyGhidra, and BSim; this article stays on the GUI path.
Hardware: official floor is 4 GB RAM, 1 GB install space, dual monitors strongly suggested. That is “it opens”. Drag in tens of megabytes of firmware and you want 16 GB; 32 GB is when the browser stops fighting you. Sizing CPU/RAM/disk is the same kind of arithmetic we used in OpenClaw 2.0 VPS Benchmark: How Much CPU, RAM, and Disk Does a Linux Cloud Server Need? — different tool, same lesson: long analysis jobs blow RAM before they blow CPU.
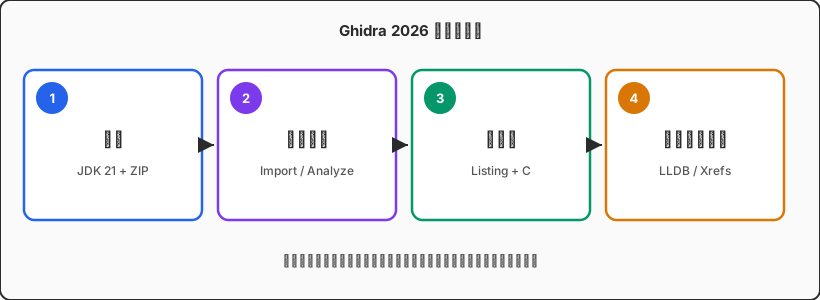
Install: JDK 21 first, then the official ZIP — not the source tarball
Ghidra 12.1 wants a 64-bit JDK 21. If the box only has 17 or 11, the launcher hunts for 21 and prompts for a Java home. Same story on Windows, macOS, and Linux. Official free LTS sources are Adoptium Temurin and Amazon Corretto. Install 21 from the Adoptium Temurin releases page, confirm java -version prints 21, and point JAVA_HOME at the JDK root (parent of bin), not a stripped JRE.
Then grab the multi-platform ZIP under Assets, named like ghidra_12.1.3_PUBLIC_20260817.zip. Do not click “Source Code (zip)” unless you plan to Gradle-build it. The 12.1.3 SHA-256 is 93a5d11a9ad510622acaaf908c556a7b9b764d338e78a7567f3689bf5081fd54. Hash the file locally; if it does not match, delete and download again.
shasum -a 256 ghidra_12.1.3_PUBLIC_20260817.zip
                # expect: 93a5d11a9ad510622acaaf908c556a7b9b764d338e78a7567f3689bf5081fd54
Unpack somewhere writable — not a sync-locked cloud-drive root. Run ./ghidraRun or ghidraRun.bat. First launch asks for a project directory. Debugger and PyGhidra also want Python 3.9–3.14; on macOS, LLDB usually arrives with Xcode; on Linux prefer GDB 13+ with embedded Python 3. Distro packages lag; learn on the GitHub zip.
First session: Project, Import, Analyze — do not mash Next
File → New Project. Non-Shared is enough for solo work. Import a binary you compiled or a sample you are authorised to hold. Check the guessed format (ELF / Mach-O / PE) and language (x86:LE:64, AARCH64:LE:64). Apple Silicon Mach-O is AARCH64; an x86_64 Linux build is x86-64. A wrong language shreds function boundaries for the rest of the day.
Double-click into CodeBrowser. Auto Analysis is fine for small teaching binaries; on huge firmware, drop expensive analyzers until the first decompile appears. Wait for the progress bar. Renaming mid-analysis is how you lose names to a later pass.
When it finishes, build a coordinate system: Imports/Exports, Defined Strings, Functions. Imports show libraries, strings show errors and URLs, the function list shows whether auto-analysis sliced the main path into confetti. Those three views beat diving into entry blind.
Decompiler: Listing on the left, pseudo-C on the right, names in the middle
Click an instruction and the C window scrolls; click a variable and Listing highlights. That two-way jump is the basic skill — more reliable than pasting raw pseudo-C into a chat model that cannot see your comments or types.
Output quality tracks the types you feed it. Default undefined4 and char * read like a draft. Relabel with L, comment with ;, rename functions in either pane. Change FUN_100003f80 to parse_config_line and every xref updates. Names are hypotheses: wrong names get you yelled at by the next xref, which is the point.
Borrow types from headers and debug symbols. If it is your own build, keep DWARF/PDB. If symbols were stripped, reconstruct structs slowly from imports, strings, and domain knowledge. Ten minutes in the Data Type Manager turns a pile of offsets into field names.
| Question | Window | Avoid |
|---|---|---|
| Real bytes and branches | Listing | Trusting C without addresses |
| What the function does | Decompiler | Treating unnamed FUN_* as truth |
| Who calls it | References / Function Graph | Guessing from one stack |
| Which libraries | Imports / Exports | Ignoring dynamic names |
Debugger: launch a binary you just built, then set breakpoints
The 12.1 Debugger talks to the host debugger through Python: GDB on Linux, LLDB on macOS (usually via Xcode), WinDbg-family connectors on Windows. You need Python 3.9–3.14 and connector packages such as protobuf. Ghidra does not replace GDB/LLDB; it syncs their session into a Trace so static C and live registers sit side by side.
A legal first debug: a tiny program you compiled five minutes ago. Pick the matching launcher, run it, break in a function you wrote, single-step, and see whether registers match the decompiler story. If not, fix types and names, then run again.
Do not treat the debugger as a way to attach to arbitrary processes. Production boxes, a colleague’s session, any environment without written authorisation — stay off. Unknown samples do not run on the host desktop: snapshot, VM, or a dedicated machine first. Isolation discipline is the same idea as Is OpenClaw 2.0 Safe on a VPS? A 7-Day Audit of Permissions, SSH, API Keys, Browser, and Agent Isolation: different object, same rule — daily environment and lab environment stay split.
Binary analysis: a workflow, not vibes
For a stranger binary you are allowed to analyse, fix the order. One: format, architecture, stripped or not. Two: strings and imports — mark network, file, and crypto libraries. Three: walk main / entry and name only the main path. Four: Function Graph on the hot function — error handling versus business forks. Five: structs on parsers, then re-read the C.
Xrefs save days. A suspicious global: do not guess writers — open references. Writers are usually parsers; readers are consumers. Name both ends and the call chain appears. Bookmarks are “come back tomorrow”; comments are hypotheses and counter-evidence, not a pile of TODO.
Scripts belong on repetitive work: bulk rename, tag by string pattern, export function lists. Start with built-in scripts. Headless is for CI on your build artifacts: import each release, confirm key functions still exist and the import table did not grow a library it should not have. That is engineering hygiene, not an attack drill.
Usual failures: Java, RAM, fonts, remote desktop, dirty daily accounts
Launch failures are usually Java. Homebrew java may be 25; a corporate image may be stuck on 17; Ghidra 12.1 wants 21. Pin Temurin 21 with JAVA_HOME. Next is heap: large firmware freezes the UI. Raise the JVM heap next to the launch scripts, and close the design-tab graveyard in the browser.
HiDPI and remote desktop (including cloud-Mac VNC) distort fonts and splitters. Set a type size you can read for two hours. Keep the project off iCloud/OneDrive — sync fights shred .rep files. Local disk, pack your own backups.
Hygiene: no personal cloud drive, no production SSH, no permanent company keys on the analysis box. Ghidra is a viewer; risk is the sample and whatever else is logged in. A dedicated cloud Mac exists so you can snapshot, roll back, and keep the laptop on your knees clean.
FAQ
Does Ghidra 12.1.3 run on Apple Silicon?
Yes. It is a Java app — install the aarch64 JDK 21. Pick AARCH64 for Mach-O; debug with LLDB. Rebuild natives from the zip if the decompiler complains, per Getting Started.
Must I use 12.1.3, or is 11.x fine?
Old projects may open; you should still move. 12.1 requires JDK 21 and 12.1.3 fixes issues in older 12.1 builds. New machines should start on the current public release, not a parallel universe because a tutorial screenshot said 11.
Can I ship the decompiled C as source?
No. It is guessed pseudo-C. Types, aliases, and optimised control flow lie. It is a reading aid. Conclusions need Listing plus observed behaviour.
Can I analyse malware?
Yes, if you have a lawful research context and an isolated environment. Do not open unknown samples on a daily OS, and do not park them on an uncontrolled share. This article does not cover exploitation or distribution.
Ghidra 12 · isolated analysis box
Move decompilation off the laptop you live on
Ghidra 12.1 wants JDK 21, large files eat RAM, and debugging wants a clean LLDB/Python stack. None of that should share a disk with your browser profile, work mail, and sync clients. A cloud Mac mini idles cheap, snapshots cleanly, and Apple Silicon memory bandwidth will sit through an overnight analysis. When you power it off, the sample is not still on your knees.